")
MLS Listings in Walnut Creek Market Report
As a buyer in the current real estate market, it’s crucial to understand the correlation between different metrics to make informed decisions. Let’s dive into the data from last month to see how these metrics interconnect by analyzing MLS listings in Walnut Creek.

Months Supply of Inventory
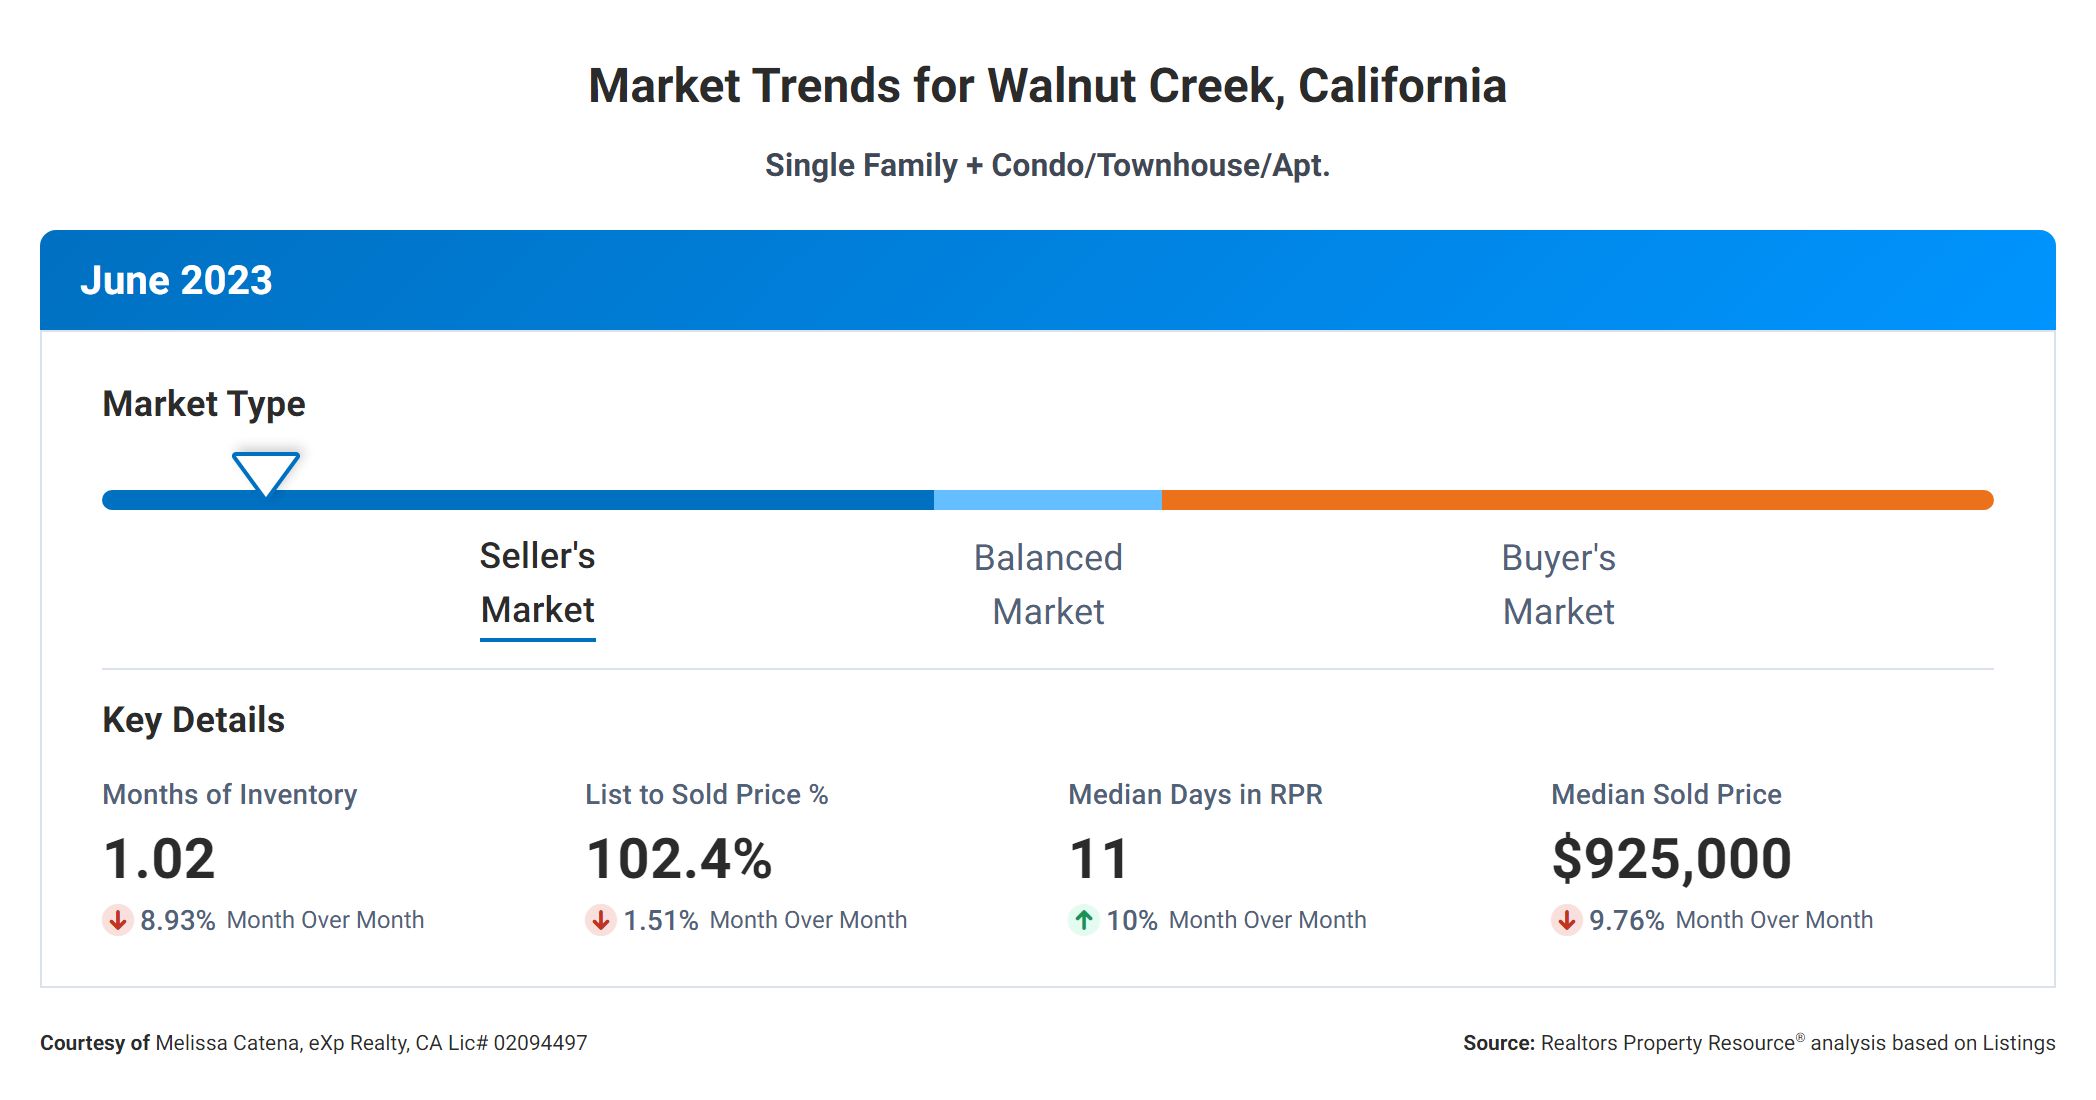
First, let’s look at the Months Supply of Inventory, which is at 1.02. This metric represents the number of months it would take to sell all the available homes on the market if no new MLS listings in Walnut Creek were added. A lower number indicates a seller’s market, where demand is high, and supply is limited.
12 Month Change of MLS Listings in Walnut Creek
Now, let’s consider the 12-Month Change in Months of Inventory, which shows a decrease of 11.3%. This decline suggests a shrinking inventory of MLS listings in Walnut Creek over the past year. This indicates a tighter market with fewer available homes and can create competition among buyers, potentially driving up prices.
Median Days Homes are On the Market
Moving on to the Median Days Homes are On the Market, we see that it is only 11 days. This metric tells us how long homes typically stay on the market before being sold. With such a short duration, it indicates a fast-paced market where properties sell quickly. Buyers should prepare to act swiftly and make timely offers.
List to Sold Price Percentage
Next, let’s discuss the List to Sold Price Percentage, which stands at 102.4%. This metric reveals the percentage of the listing price that homes typically sell for. A value above 100% suggests that buyers will often pay above the asking price. This indicates a competitive market. It’s important for buyers to be prepared for potential bidding wars or higher price negotiations.
Median Sold Price of MLS Listings in Walnut Creek
Finally, we have the Median Sold Price, which is currently $925,000. This metric represents the middle point of all the sold prices in the market. It indicates the overall price range of homes being sold. With a median price of $925,000, it suggests that the market consists of higher-priced properties.
When we consider all these metrics together, we can draw some conclusions. The low Months Supply of Inventory and the decreasing 12-Month Change in Months of Inventory indicate a limited supply of homes. The short Median Days Homes are On the Market and the List to Sold Price Percentage above 100% highlights the high demand and competitive nature of the market. These factors, combined with the higher Median Sold Price, suggest a seller’s market where buyers may face challenges in finding affordable properties and may need to act quickly.
As a buyer, it’s essential to be prepared. The best place to start is to work closely with a trusted real estate agent, and carefully consider your budget and preferences. Understanding these metrics can help you navigate the market more effectively and make informed decisions.